Amid Worries, New Equity Risk Premium Data Explained
-

-

Published Friday, August 2, 2019 at: 7:00 AM EDT
The Federal Reserve cut interest rates this past week for the first time since the 2008 financial crisis because of fears the U.S. economy was slowing. U.S.-China trade talks ended with no progress and President Trump announced additional tariffs on Chinese imports, deepening the trade war between the world's two largest economies and the chance of a global slowdown. Meanwhile, Friday's new jobs report showed continuing strength in the U.S. economy's 10-year old expansion, though slower growth could result in a cut in profit expectations in the weeks ahead, as the stock market continued to hover near its all-time high.
Amid the worries investors face, here's a reminder about this important fundamental financial concept.
A rubric of modern portfolio theory taught at colleges and universities holds that investors get paid an extra return for taking risk. The risk premium is the amount you get paid for owning a risky asset.
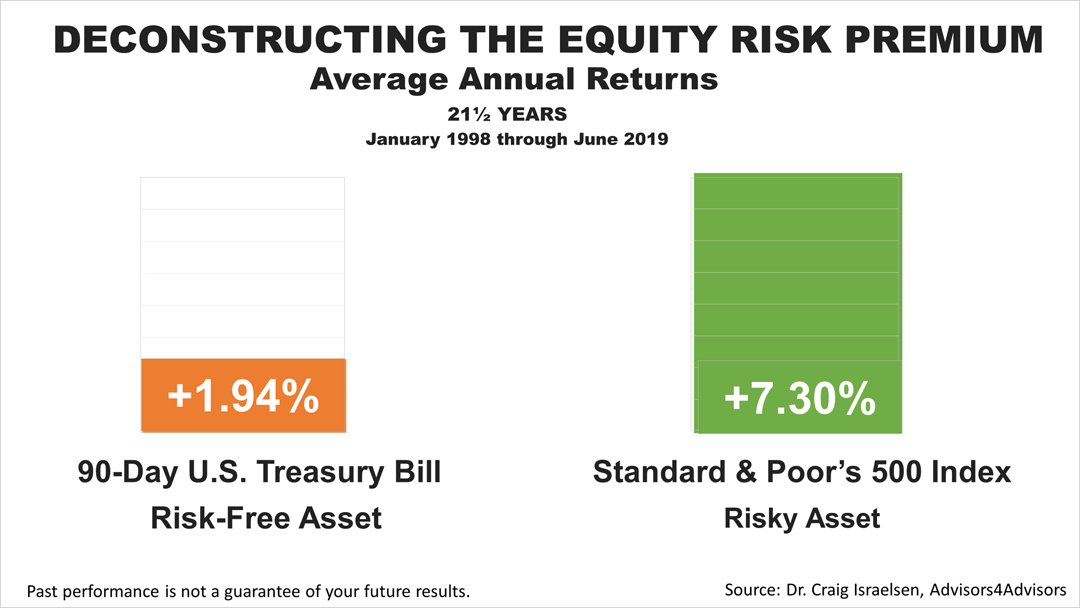
To quantify the equity risk premium, here are the numbers: Over the 21½ years ended June 30th, 2019, the risk-free 90-day U.S Treasury Bill averaged an annual return of 1.94%, compared to a 7.30% annualized return on the S&P 500 stock index, according to economist Craig Israelsen, whose research we license to share with clients and friends.
This 21½-year period encompasses two full economic and bear market cycles — the tech-bubble bursting in 1999 and the global financial crisis of 2008 — so it is an instructive period to examine.
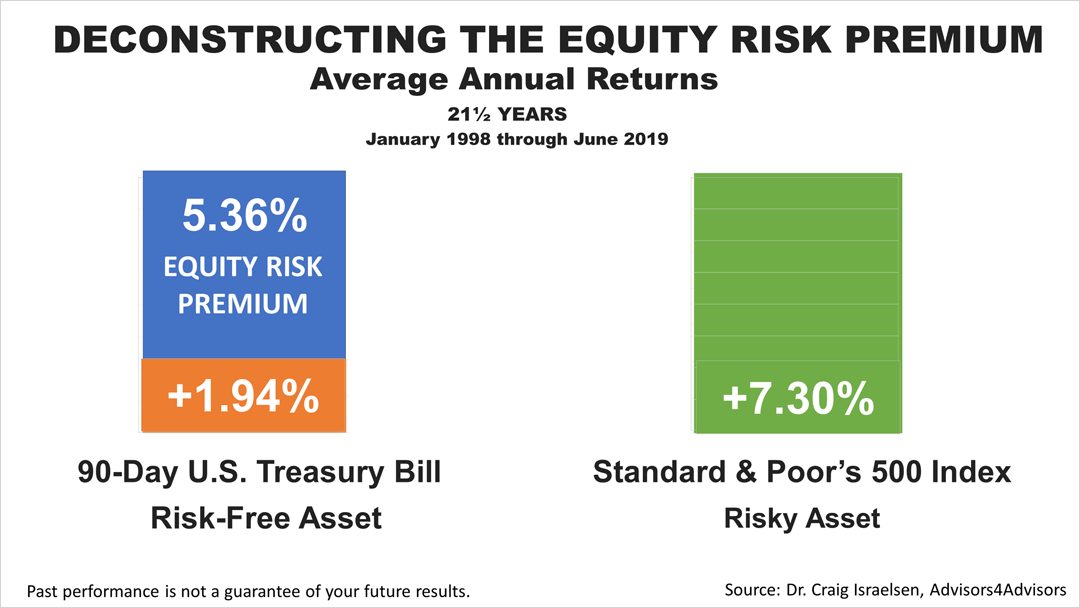
The difference between the 7.30% average annual return on the S&P 500 index and the 1.94% return on a risk-free T-Bill is 5.36%. The 5.36% — the extra return annually averaged on equity invested in America's 500 largest publicly-held companies in the 21½-year period — is the equity risk premium.
In a time of heightened uncertainty, stock investors are tested to accept higher risk if they hope to earn a premium over less-risky Treasury Bills. That's an important financial fundamental to remember in times like these.
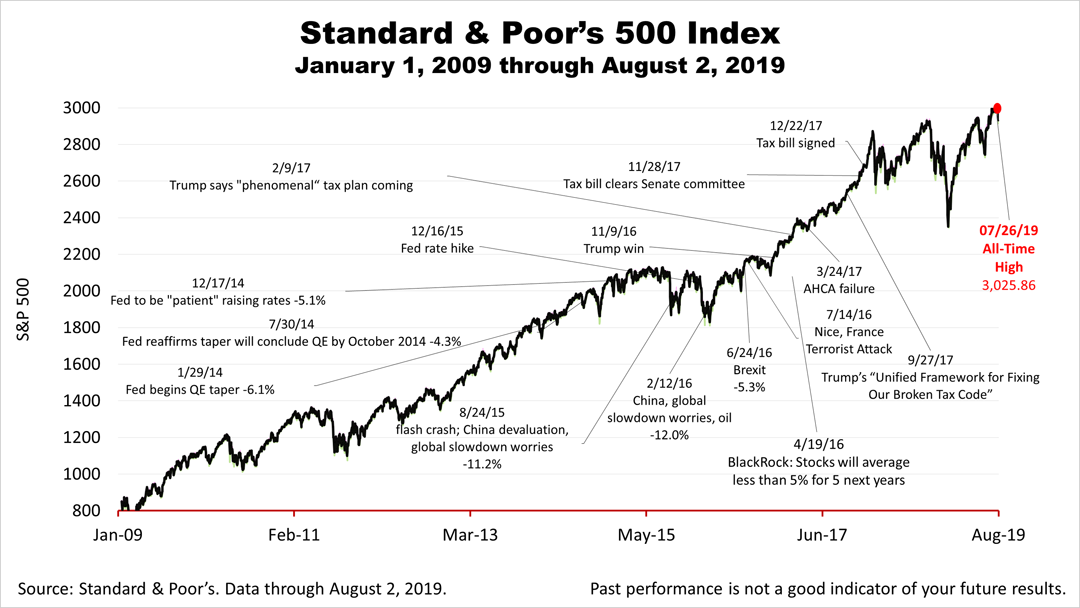
After closing at an all-time high of 3,025.86 last Friday, the Standard & Poor's 500 stock index of large public companies, closed about 2% lower to end the week at 2,932.05.
This article was written by a veteran financial journalist based on data compiled and analyzed by independent economist, Fritz Meyer. While these are sources we believe to be reliable, the information is not intended to be used as financial or tax advice without consulting a professional about your personal situation. Tax laws are subject to change. Indices are unmanaged and not available for direct investment. Investments with higher return potential carry greater risk for loss. No one can predict the future of the stock market or any investment, and past performance is never a guarantee of your future results.
This article was written by a professional financial journalist for Advisor Products and is not intended as legal or investment advice.
2024
-
 Stocks Closed At A Record High
-
 Federal Reserve Projects Strong Growth
-
 The Best People Were Wrong
-
 This Week’s Investment News In Six Charts
-
 U.S. Investor Picture Of The Week
-
 The Conference Board Backs Off Its Recession Forecast
-
 Softening Economic Data, Inflation Fears Dampen Stock Rally
-
 S&P 500 Closes Above 5000 For The First Time Ever
-
 Why America Is The World’s Economic Leader
-
 Investment News For The Week Ended Friday, January 26
-
 Why Stocks Broke The All-Time Record High
-
 A Strategic Update, With Stocks Near All-Time High And Crises Unfolding


")


